CIO’s View: February 2023 - Is it time to take another look at European equities?

The Personal Consumption Expenditure Price Index (PCE Inflation) increased by 0.6% (m/m) in January from the month before, which is an accelarated pace from 0.4% (m/m) recorded in December. The annual rate rose by 5.4% (y/y) in January from the same month last year, which is also an accelerated pace from 5.3% (y/y) recorded in December. Core PCE inflation, which is the Fed’s preferred gauge of inflation that strips out volatile food and energy price, rose by 0.6% (m/m) in January from the month before, which is an acceleration from 0.4% (m/m) in December. The annual rate increased to 4.7% (y/y) in January from 4.6% (y/y) in December.
US Retail Sales increased sharply in January at 3% (m/m) from the month before, which was one of the biggest monthly increases over the past 20 years. This indicates that US consumers have not pulled back on discretionary spending despite the high inflation environment.
Meanwhile, the report on Non-Farm Payrolls (NFP) showed that hiring more than doubled in January at 517,000 from 223,000 in December, and nearly tripled from 185,000 in November. The Unemployment Rate (UR) declined to 3.4% in January from 3.5% in December, making it the lowest rate over the past 53 years.
At the most recent FOMC meeting on 1 February 2023, the Fed’s rate-setting committee had decided to hike the Fed funds target rate by 25 basis points to the target range of 4.5% to 4.75%, taking it to the highest level since October 2007. In this rate hike cycle that began in March 2022 in order to control inflation environment that was the highest level since early 1980s, the first hike began with a rate increase of 25 basis points to target range of 0.25% to 0.50%. Then in May 2022, the Committee increased its policy rate at a larger pace of 50 basis points to target range of 0.75% to 1.00%. After that came the larger pace of 75 basis points for four consecutive FOMC meetings to the target range of 3.75% to 4.00% in November 2022, before dialing down the pace to 50 basis points to the target range of 4.25% to 4.50% in December 2022. Then came further reduced pace of 25 basis points at the most recent early February meeting of this year.
The minutes of the most recent FOMC meeting in February had shown that most of the FOMC members were in agreement with Fed’s Chairman Jerome Powell on the reduced 25 basis points pace of rate hike. However, some members would have preferred a more aggressive 50 basis points pace or could have been persuaded to support one. Since the meeting, two Fed officials, Cleveland Fed president Loretta Mester and St. Louis Fed president James Bullard, said they would have supported a larger 50 basis points rate increase at the time. However, neither Mester nor Bullard are voting members of the committee.
Utilizing the CME FedWatch Tool to look at the market’s interpretation of rate hike’s probabilities at each of the upcoming FOMC meetings this year, we noticed that the probability of 25 basis points increase at the 22 March 2023 meeting to the target range of 4.75% to 5.00% had declined to 73.05% on 25 March 2023 from 81.20% a month ago, while the probability of a 50 basis points increase to the target range of 5.00% to 5.25% had increased to 26.95% from 0% over a month ago. Meanwhile, the probability of the terminal rate being 5.25% to 5.50% at the 14 June 2023 meeting had increased to 56.79% on 25 February 2023 from merely 2.70% over a month ago. This indicated that the market had been pricing in more aggressive and prolonged scenario from the Fed.
Chart: Fed’s target rate probabilities for 22 March 2023 FOMC Meeting
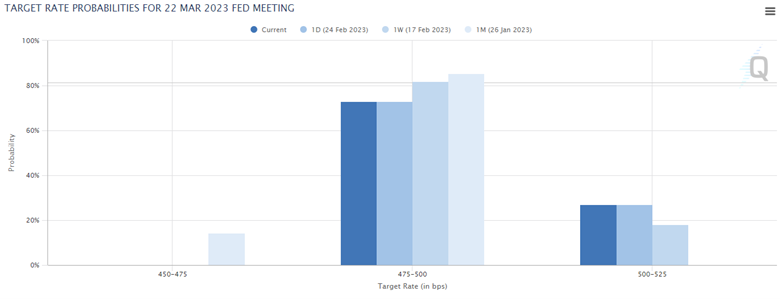
Source: CME FedWatch Tool, CME Group, as of 25 February 2023.
Chart: Fed’s target rate probabilities for 14 June 2023 FOMC Meeting
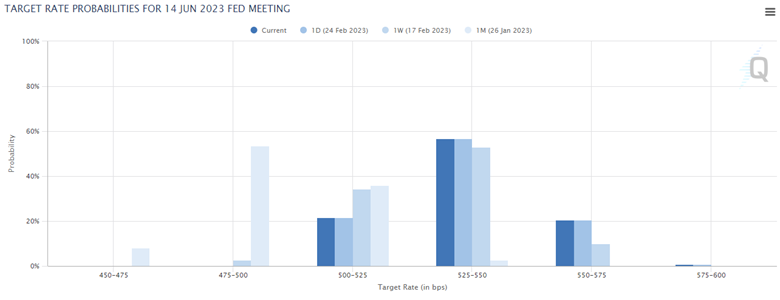
Source: CME FedWatch Tool, CME Group, as of 25 February 2023.
The continuously declining price of the Dutch TTF Natural Gas Futures has benefitted the Eurozone economy tremendously. Natural gas price used to trade at EUR346 per megawatt hour at the peak, back in the middle of August 2022. Most recently, it has come down to trade at EUR50 per megawatt hour, which was a 85% decline from the peak level at that time. Eurozone economy had avoided a contraction in the fourth quarter, as it managed to secure a 0.1% GDP growth from the previous quarter, although it was a slowdown from 0.3% expansion rate recorded during the third quarter.
The more timely indicator such as the Eurozone Services Purchasing Managers Index has been showing more encouraging sign compared to the US Services Purchasing Managers Index, as I suspect that the Eurozone economy has benefitted more from the declining natural gas prices due to the heavier reliance on natural gas. This has also translated into an increasingly better performance of Europe’s STOXX 600 versus the US’s S&P 500 index of late. This is also indicative of European market’s ability to price in good macro factors, as opposed to the US market that has been negatively taking good news to mean a more aggressive Fed outlook.
As for the ECB, we still expect it to continue with its 50 basis points hike to the Deposit Rate to 3.00% level in the Governing Council Meeting in March. After that, we expect the Governing Council to reduce the pace of rate hike to 25 basis points, by then taking it to 3.25% in May. Comes June, we expect that to be the end of the ECB’s rate hike cycle, with another 25 basis points hike, putting the Deposit Rate at 3.50%. However, we feel that the European stock market should have the ability to withstand 2-3 more times of rate hikes due to its attractive long-term valuation such as the Forward Price-to-Earnings Ratio that is currently trading at around 12 times, below its long-term historical average. We recommend investors who are interested in a European equity exposure to check out our fund – Principal European Equity Fund A (PRINCIPAL EUEQ-A) based on the positive factors that we had mentioned.
Chart: Dutch TTF Natural Gas Futures Price
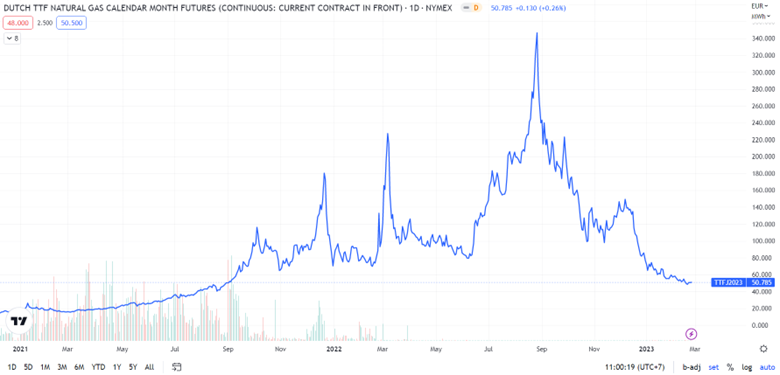
Source: TradingView, as of 26 February 2023.
Chart: Eurozone versus US Services Purchasing Managers Index
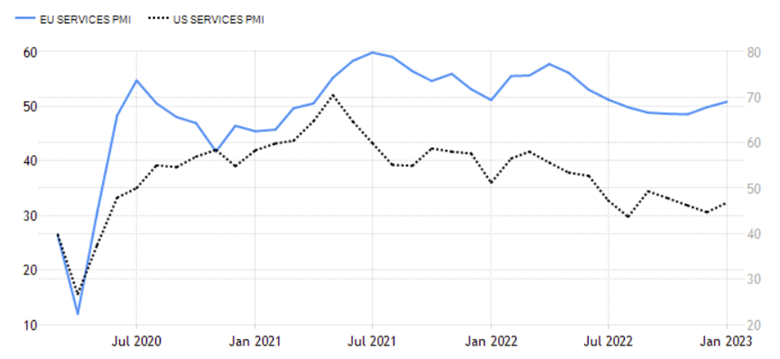
Source: Trading Economics, as of 26 February 2023.
Chart: Performance of STOXX 600 versus S&P 500 Index
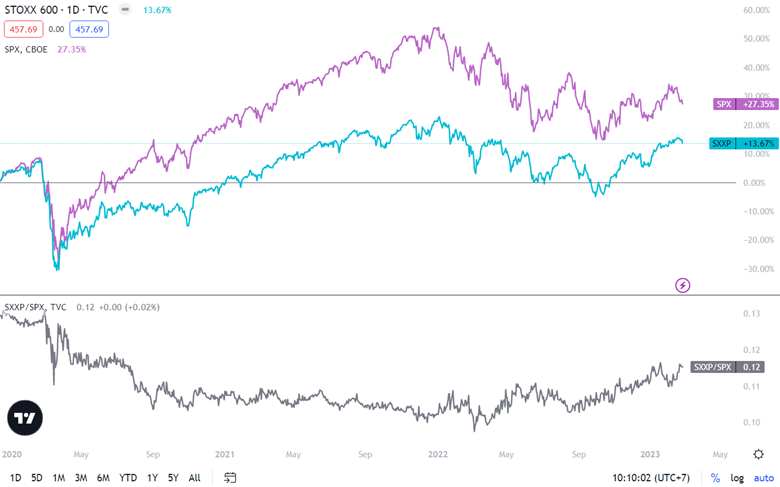
Source: TradingView, as of 26 February 2023.
Chart: Forward Price-to-Earnings Ratio of STOXX 600 Index
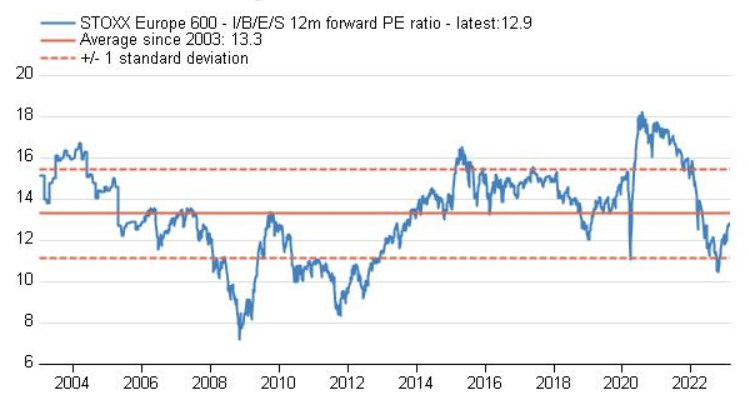
Source: Refinitiv Datastream, as of 26 February 2023.
Read CIO’s View: February 2023 - Is it time to take another look at European equities?