CIO View: July 2023 - Global Infrastructure as a portfolio hedge against market volatility

By Supakorn Tulyathan, CFA-Chief Investment Officer
27 July 2023
By now, the Fed has raised its policy interest rates by 525bps, taking the Federal Funds rate up to 5.25%-5.50% from 0.00%-0.25% before the first hike began in March 2022. This has been the most aggressive tightening since 1980. Historically, when the Fed raised rates significantly, it resulted in some type of crisis. In the current cycle, there is a risk that the Fed may not be finished with its rate hike campaign, with the FOMC own set of forecasts indicating one more rate hike to 5.50%-5.75%. With the labor market continuing to show resilience and core inflation staying stubbornly high, the Fed might deliver as forecast. This may catch the market by surprise, as the concensus is priced for a “hold” after the Fed has reached 5.50%. Each additional rate hike increases economic and financial pressures, raising the probability of recession and further crises down the road.
Even as the global economy currently looks strong, leading indicators are signaling oncoming recession. The Conference Board’s leading indicator has been contracting for 11 months, while a decline for six or more consecutive months has historically anticipated recession. Expectations of a broader slowdown are corroborated by the ISM Manufacturing survey, which has been in contraction since November 2022. The New York Fed’s recession model suggests that the probability of recession within the next 12 months is the highest since the early 1980s. The Treasury yield curve remains deeply inverted – a historically reliable recession indicator. Their most recent model forecasts a 67% probability of recession in the next 12 months – this is even higher than the 30%-40% range that preceded the early 1990s recession, the early 2000s recession, the Great Financial Crisis recession, and the Covid-19 recession.
Leading indicators almost uniformly signal weaker economic growth, with the full effects of significant and aggressive Fed tightening yet to be fully recognized. Consumer activity has been strongly supported by the historically large excess savings cushion. However, savings are gradually being eroded by exuberant spending, inflation, mortgage costs, and time. At the current pace of drawdown, excess savings will be exhausted by 4Q 2023, removing a major support structure for the US economy. As such, we are expecting recession to begin in Q4 and to last only 2 quarters. With a recession likely to be short and shallow, we expect a resulting pullback in risk assets to be swift requiring us to be nimble and ready to deploy available cash when the time comes.
Chart: Fed funds rate and crisis events
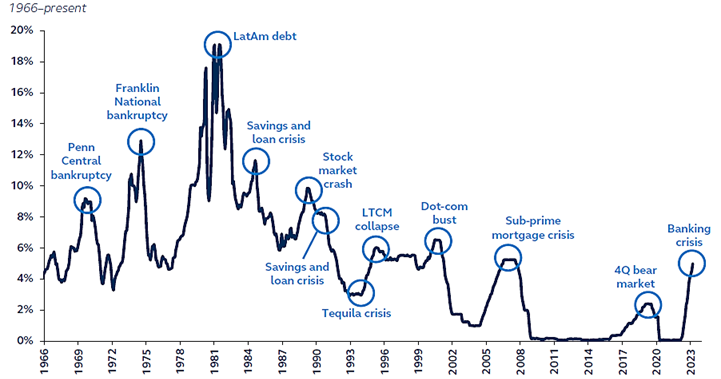
Source: Federal Reserve, Bloomberg, Principal Asset Management. Data as of 31 March 2023.
Chart: US recession probability in next 12 months
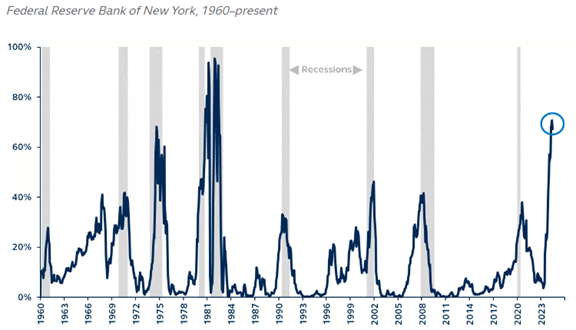
Source: Federal Reserve Bank of New York, Bloomberg, Principal Asset Management. Data as of 30 June 2023.
Chart: Aggregate excess savings following recession
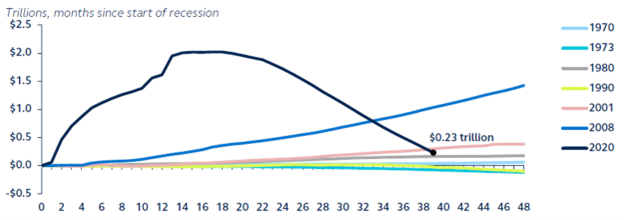
Source: Bloomberg, Principal Asset Management. Data as of 30 June 2023.
Principal Asset Management has done an excellent study on “Lessons from the 70s: No space for rate cuts in 2023” in the publication of the “Global Asset Allocation Viewpoints” for 3Q23. The key insight from the study is reproduced here. The striking similarities between US inflation developments today and those of the early 1970s could be instructive for the path forward. During the inflation spike of that period, the Fed also responded with steep interest rate hikes. After some time, the Fed was anxious to ease monetary policy, cutting interest rates before inflation had fallen back to levels consistent with price stability. The result was a resurgence in price pressures. Lowering interest rates before the Fed is confident that inflation is on a sustainable path back to 2% would threaten to undo all its hard work to date, ultimately requiring more aggressive hikes next year.
Chart: Historical inflation comparison
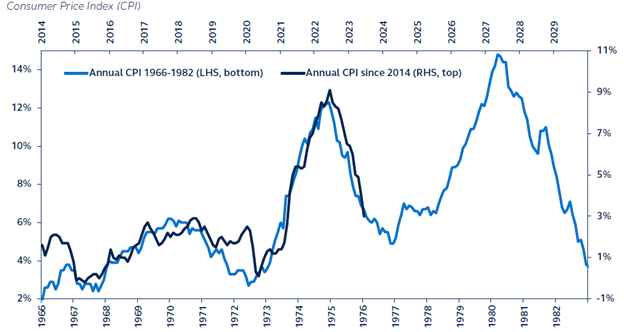
Source: Bureau of Labor Statistics, Bloomberg, Principal Asset Management. Data as of 12 July 2023.
Recall that we had an OW in global equities during the first half. As equity valuation now becomes very extended—S&P 500’s forward PE around 19x, while NASDAQ’s forward PE around 32x, we have reduced that OW call due to expensive valuation compared to history. The S&P 500 has been on an impressive run, rising approximately 16% up until the end of June. However, the rally hasn’t been broad based. Instead, it has been driven by the explosive performance of only a handful of mega-cap stocks across the technology, consumer discretionary, and communications sectors—and all by companies firmly associated with artificial intelligence (AI) excitement. The difference in YTD performances between NASDAQ 100, S&P 500 and S&P 500 Equal Weight Index points to the susceptibility of the broad US equity market to a market correction when those mega cap technology names fail to deliver the high level of earnings that investors have been expecting. We are advising investors to be cautious and skeptical about this unhealthy rally of the equity market, especially in the technology space. Diversification away from the US market and from the high concentration in tech and AI excitement is now becoming more warranted than ever. Our recent view on Alternatives asset class—global infrastructure provides diversification benefits in H2—is a call to hedge the expensiveness of the tech sector and the increasing risk of correction later in the year.
Global Infrastructure provides stable earnings, inflation hedges and potentially outperform in the current slowing growth environment. And with the run-up in equities to expensive valuation levels, listed infrastructure provides a defensive equity exposure and a laggard catchup play. The earnings profile for global infrastructure has been one of the most resilient, as can be seen from the consensus forward EPS chart provided below. Not only that its earnings profile is resilient and consistently growing, valuation of the sector is now very cheap compared to history, as it is trading at lower than -2 standard deviations compared to its long-term history. As such, we consider global infrastructure as a cheap portfolio hedge against an expensive broader equity market. While on the other hand, REITs are traditionally considered as being a defensive and low-volatility alternative asset class that is expected to perform well in a low-growth, high-volatility economic environment. However, the recent banking crisis has created intense pressure on REITs, particularly in the United States. The closure of two large regional lenders has raised concerns about banks' exposure to commercial real estate (CRE), as U.S. banks are significant holders of CRE debt. This situation may result in a reduction in the regional banks' willingness to provide commercial real estate loans, further adding to the pressure on REITs in the near future. Given our concern on the commercial real estate sector, we would prefer global listed infrastructure over REITs during H2 as a diversifier to the portfolio. Global listed infrastructure can also be considered as a tactical play for H2, as the sector has been a laggard performer this year due to fund flows favoring mega cap tech names in H1. As mega cap tech names are now expensive, switching to quality and defensive sectors now makes a lot more sense. We highlight our “Principal Global Listed Infrastructure Equity Fund” or “PRINCIPAL GIF” in short for our readers to consider as a portfolio’s diversification exposure.
Chart: Listed infrastructure performance compared to global equity and bond markets
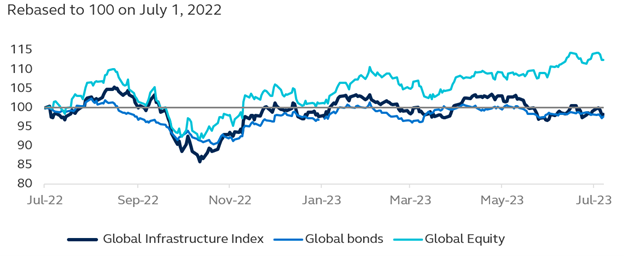
Source: Bloomberg, Principal Asset Management. Data as of 7 July 2023.
Chart: Forward P/E valuation of global infrastructure sector
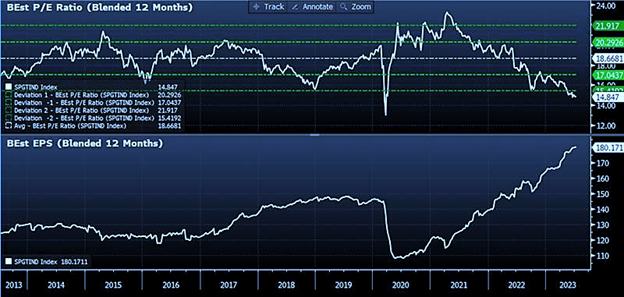
Source: Bloomberg, Principal Asset Management. Data as of 10 July 2023.
Fund Recommendation
Principal Global Listed Infrastructure Equity Fund (PRINCIPAL GIF)
Read CIO View: July 2023 - Global Infrastructure as a portfolio hedge against market volatility
Disclaimer: Investors should understand product characteristics (mutual funds), conditions of return and risk before making an investment decision. PRINCIPAL GIF Master fund has highly concentrated investment in Europe and North America. So, investors have to diversify investment for their portfolios. / Investing in Investment Units is not a deposit and there is a risk of investment, Investors may receive more or less return investment than the initial investment. Therefore, investors should invest in this fund when seeing that investing in this fund suitable for investment objectives of investors and investors accept the risk that may arise from the investment./ Past performance does not guarantee future results.