CIO View: September 2566 - Bond fundamentals turn back to being supportive in Q4

By Supakorn Tulyathan, CFA - Chief Investment Officer
29 September 2023
Many people may have already forgotten that July through September are the months that US bond market has to digest a lot of US Treasury bond supply coming to the auction market. Due to debt ceiling fight that happened during the second quarter this year between the Democrats and the Republicans, the US Treasury Department used up their cash that were held at the US Treasury General Account (chart below), which was reduced to as low as $48.5 billion at the end of May. As part of the market communication that was released on 31 July 2023, we know that the US Treasury targeted to have their cash balance in the amount of $650 billion for the July to September 2023 quarter, and $750 billion for the October to December 2023 quarter. Therefore, there was a gap of around $700 billion in cash levels that the US Treasury would have to build up from bond auctions. And as a result, the expected amount of bond auction (chart below) that was announced by the US Treasury for the July to September 2023 quarter was a whopping $1,007 billion, a very high amount when compared to $657 billion actual borrowing from the previous quarter, and $457 billion from the same period a year before. This heavy supply dynamics has been putting upward pressure on US bond yields in the current quarter. However, we do expect this to ameliorate as we move into the month of October, as the expected supply for the last quarter of the year will now drop to $852 billion, unless there is significant change in the planned amount from the US Treasury that should be announced in early October.
Also worth mentioning here is the level of the Fed’s balance sheet (chart below) that had been declining as a result of the Fed continuing to reduce its bond holdings that had been accumulated through the Quantitative Easing (QE) program to the peak amount of close to $9 trillion during March 2022. The latest numbers from the Fed shows that it is now at $8.02 trillion as of 20 September 2023. Comparing this number to the end of June tells us that the Fed has approximately done Quantitative Tightening (QT) in the amount of $316 billion, which also exerted an additonal upward pressure on bond yields during the past quarter.
Chart: US Treasury General Account (millions of US dollars)
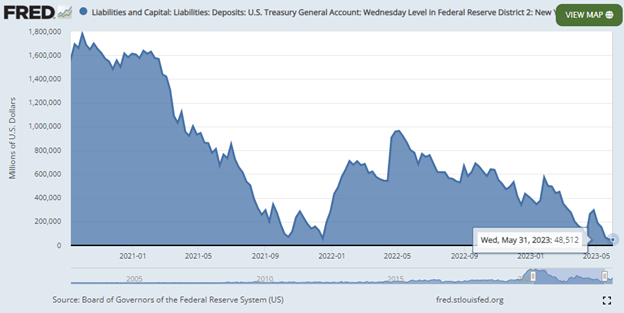
Source: US Board of Governors of the Federal Reserve System (US). Retrieved from FRED, Federal Reserve Bank of St. Louis; https://fred.stlouisfed.org/series/D2WLTGAL, 26 September 2023.
Chart: US Treasury Quarterly Borrowing Amount (billions of US dollars)
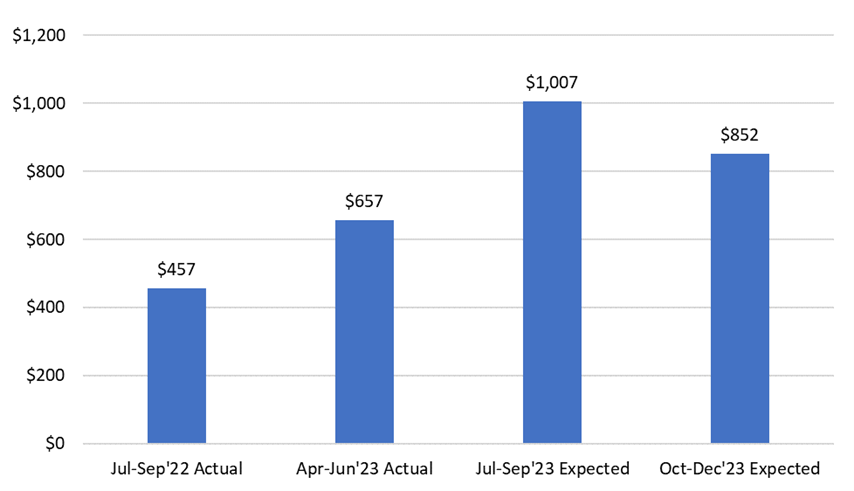
Source: US Department of the Treasury, Principal Asset Management. Data as of 31 July 2023.
Chart: Fed’s Balance Sheet
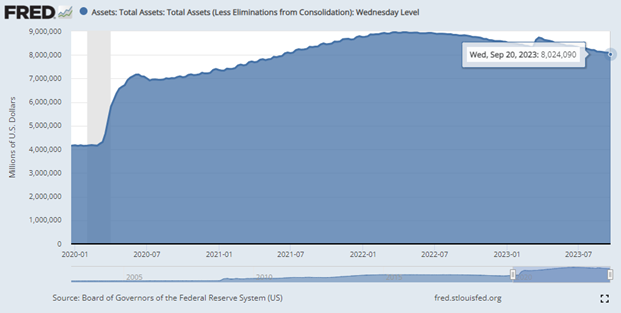
Source: Board of Governors of the Federal Reserve System. Retrieved from FRED, Federal Reserve Bank of St. Louis; https://fred.stlouisfed.org/series/WALCL, 26 September 2023.
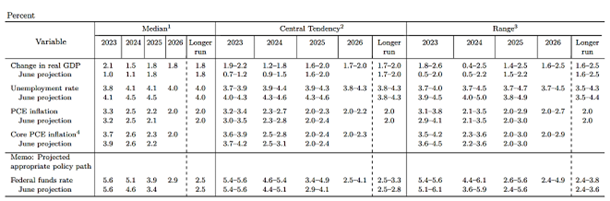
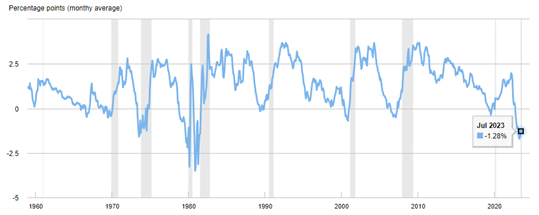
On 20 September 2023, the Fed held its benchmark interest rates at 5.25% to 5.50%, but indicated that it still expects one more hike before the end of the year (table below), and fewer rate cuts than previously indicated during June FOMC. Along with the rate projections, the Fed also sharply revised up its GDP growth expections for this year to 2.1% (from 1.0%), and for next year to 1.5% (from 1.1%), which is a total GDP revision for the two years of 1.5%. Not only that this is a reiteration that they don’t expect a recession to happen during their forecasting horizon, it is a message of a much stronger economy than what they were expecting three months ago. This has caught the market by surprise, as the market was expecting quite a high degree of probability (chart below) that a recession was due to happen during 1H24 with a chance of above 60%, according to a calculation by the New York Fed. All this has essentially resulted in an upward yield movement of +70 basis points to 4.54% for the US 10-year bond yields, as of 26 September 2023 compared to the end of June, as market needed to price out the inverted yield curve in the bond market due to recession expectation (chart below).
Chart: Economic Projections from September 2023 FOMC Meeting
Source: Source: Federal Reserve Bank of New York, The Yield Curve as a Leading Indicator, https://www.newyorkfed.org/research/capital_markets/ycfaq.html. Data as of 10 September 2023.
Chart: Probability of US Recession, 12 Months Ahead
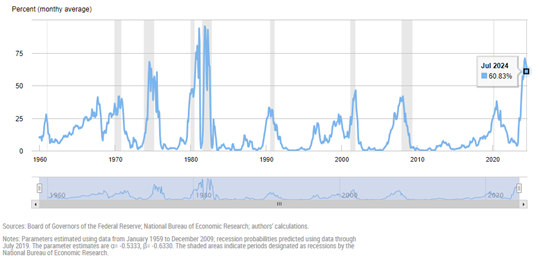
Source: Federal Reserve Bank of New York, The Yield Curve as a Leading Indicator, https://www.newyorkfed.org/research/capital_markets/ycfaq.html. Data as of 10 September 2023.
Chart: US Treasury Term Spread between 10-year and 3-month Bond Yields
Source: Federal Reserve Bank of New York, The Y Leading Indicator, https://www.newyorkfed.org/research/capital_markets/ycfaq.html. Data as of 10 September 2023.
Lastly, given the elevated level of yields and the Fed’s own outlook of slowing growth next year to 1.5% and 50 basis points of rate cuts, this is an opportune time to add to duration exposure by adding fixed income to your portfolio. We couldn’t agree more that this is the best time to take advantage of the high bond yields that we have not seen since 2007. We reiterate our recommendation to check out our Principal Global Fixed Income Fund (PRINCIPAL GFIXED) for your global fixed income exposure. To reiterate the superiority of the master fund PIMCO GIS Income Fund’s performance, I’ve compared its YTD return against some of the bond ETFs that can usually be considered as global bond benchmarks; i.e. USAG for US aggregate bond, LQD for USD investment grade credits, HYG for USD high yield credits, and EMB for USD emerging market bonds. Our master fund PIMCO GIS Income Fund showed a very robust performance in the YTD against these bond ETFs due to its shorter-duration profile (around 3-plus years) and PIMCO’s strong record in credit selection.
Chart: YTD Return Chart of PIMCO GIS Income Fund (shaded line) Compared to other ETFs
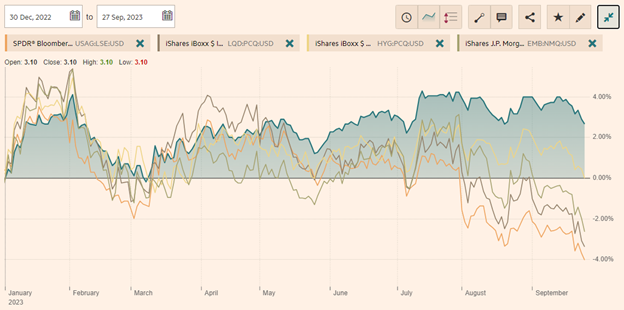
Source: Financial Times. Data as of 26 September 2023.
Fund Recommendation
Read CIO View: September 2566 - Bond fundamentals turn back to being supportive in Q4
Disclaimer: Investors should understand product characteristics (mutual funds), conditions of return and risk before making an investment decision./ PRINCIPAL GFIXED has a policy of investing in the global market, so investors may lose or gain money due to exchange rate fluctuations. They may also receive an investment value lower than their initial investment / Past performance does not guarantee future results.